
Real-time Timbral Analysis for Musical and Visual Augmentation
Real-time Timbral Analysis for Musical and Visual Augmentation
Interactive Project Report
Published: Feb 26, 2025
Authors
Martin Daigle (McGill University), Pauline Patie (Université de Montréal)
Introduction
The Real-time Timbral Analysis for Musical and Visual Augmentation project explores the potential of real-time machine learning (ML) techniques to create dynamic visuals in the context of musical improvisation and composition. This artistic research aims to enable musicians to interact with visuals that respond directly to their performance, thereby guiding listeners' perception through visual representations of changes in timbre and spectrum. The project incorporates software tools such as sp.tools, FluCoMa, Max MSP, and TouchDesigner to achieve real-time instrumental augmentation for musicians, offering a unique way to visualize musical parameters.
This project was funded by an ACTOR student grant, additionally, funding from CIRMMT allowed us to work with guitarist Emmanuel Jacob Lacopo, and a grant from IIICSI allowed us to keep working on the project throughout 2024-2025. Martin Daigle was also awarded a SSHRC to fund his doctoral project on drum kit performance. The PIs of this research are Martin Daigle and Pauline Patie. Martin is a drum kit performer in the Doctor of Music program at McGill University, specializing in augmented drum kit repertoire. Pauline is a master's student at the University of Montreal, working on her thesis on the design of audiovisual systems for live performances, with a particular focus on interactivity. We decided to combine our interests and expertise in this research-creation project to explore the possibilities within our shared field of study. Additionally, we explored this process with Emanuel Lacopo, a guitarist in the Doctor of Music program at McGill University, specializing in electric guitar repertoire.
Goals
Audiovisual (AV) software increasingly integrates machine learning (ML) and advanced interactions between audio and video elements. However, these tools often prioritize either audio or video, rather than fully exploring their dynamic interplay. A key goal of this project is to move beyond traditional loudness-based audiovisual interactions, where musical activity is primarily represented by loudness and translated into visual effects through amplitude. Many audiovisual synchronization systems emphasize the connection between amplitude or loudness and visual elements like brightness or color. Notable examples include Vladimir Baranoff-Rossiné's Piano Optophonic (1920) and Robert Henke's audiovisual performance Lumière No 6 Excerpt II 45 (2014), where high-powered lasers create synchronized visual effects—dots, circles, and variations in opacity and brightness—closely aligned with the accompanying sound.
In many musical contexts, listeners can observe a variety of intriguing musical parameters. Musicians often explore harmonic, melodic, rhythmic, and timbral elements during a performance. Inspired by this, we sought to expand the audience's experience by enabling them to observe multiple sound parameters beyond loudness. This prompted us to investigate different musical parameters and explore how combinations of these parameters could be used to control and generate visuals. Exploring the use of visuals as a score for musicians to interpret offers an intriguing possibility. This feedback loop enables musicians to create and modify the visuals while simultaneously drawing inspiration from them. To better explore ML-driven, nuanced, and generative AV interactions, we needed to create a framework that streamlines the interactive process between musical performance and visual processing. We aimed to explore various audio descriptors, such melbands, loudness, pitch, spectral shape, and MFCCs (Mel Frequency Cepstral Coefficients). These descriptors are particularly well-suited for visualizing timbre, guiding the audience toward the most prominent aspects of the musical activity and seamless experience between audio and video elements.
Methods
Our approach was exploratory. Through trial and error, we continually refined our understanding of the desired AV interaction for each musical scenario. The project evolved through meetings, jam sessions, and patching experiments. This process created a feedback loop that allowed us to test ideas and make adjustments along the way. A central focus of this process was the exploration of interactivity between musical performance and visuals. All of these efforts were aimed at capturing and exploring the subtle nuances between performers. Our primary technical methods for generating visuals rely on sp.tools, which is built on the FluCoMa external and allows us to gather data from a sound input. The software enables real-time recognition of descriptors such as loudness, pitch, flatness, spectral shape, and melbands, which we will define in the next section. The processing uses a Fast Fourier Transform (FFT), with analysis conducted through a window-based approach (using 256, 4410 samples, or the entire sample). sp.tools has been developed within Max (Cycling '74) and requires it to run. These descriptors are then routed into a visual development software called TouchDesigner to control various visual parameters. The patches developed during 2023-2024 use descriptor data from instrumental performance, such as drum kit and guitar performance as input for different generative visual functions which were crafted empirically in TouchDesigner.
Descriptor Definitions
The following definitions are simplified and edited from the FluCoMa project reference page. Their objects calculate descriptors that are aimed to accurately model human perception and capture key elements of sound, such as intensity, pitch, and harmonic content.
Melbands: generates a spectrum based on the Mel scale, which reflects how humans perceive pitch, especially in lower and higher frequencies.
Loudness: the perception of sound pressure. Humans perceive sounds as being “loud” or “quiet”.
Pitch: refers to the analysis of the fundamental frequency.
Spectral Shape: represents the shape of a sound's spectrum and provides insights into its characteristics. It calculates and combines seven descriptors, offering information about how "spread out" the spectrum is, where its "center" lies, or how "flat" or "tilted" the overall shape appears.
Mfccs: is short for Mel-Frequency Cepstral Coefficients (“cepstral”). This analysis is often used for timbral description and timbral comparison. It compresses the overall spectrum into a smaller number of coefficients that, when taken together, describe the general contour of the spectrum.
Instrumental Setup

Figure 1: instrumental setup.
The instrumental setup (fig. 1) is separated into two levels of processing:
AUDIO: The drumkit and guitar are connected to the laptop with the use of an audio interface. The sound sources of the drum kit and guitar are processed and analyzed to generate real-time descriptor data.
VIDEO: These streams of descriptor data are sent to TouchDesigner via OSC to control visual processing.
We experimented with various setups throughout the project. In some instances, audio interactions from augmented instruments required two computers, with OSC data transmitted via a router. Depending on the musical and artistic requirements at the time, we adjusted the setup to suit the needs of the moment.
AUDIO
For the Machine Learning patch, a combination of audio inputs from the guitar and drums are connected to the computer via an audio interface. The signal is then processed through various sp.tools objects including sp.descriptors, sp.speed, and sp.onset to output several descriptors such as loudness, pitch, spectral shape, mfccs, melbands, speed in real time.

Figure 2: Max MSP patch.
The Max MSP patch only has two mono instrumental inputs. The drum microphones are mixed into one mono signal that is sent in the processing chain. For the guitar, one mono channel post-effect is used. Throughout this process, we experimented with various setups and tools. Initially, we used multiple microphones and processing chains to create separate inputs for each drum kit component. For the guitar, we previously employed two signals: a direct, unprocessed signal to capture sharper onsets, and a post-effects signal to preserve the sound shaped by various effect pedals. Due to overwhelmingly large quantities of data, we resorted to one mono channel per instrument. Fundamentally, this project is created in a manner that will work with various instrumentation and is not limited to drums and guitar. When connected to this system, any instrument can generate variations in the descriptor data, and in turn, control visual processing.
VIDEO
The approach to the video aimed to simulate changes in timbre through a series of varying aesthetics. Patches were created in Touch Designer, which facilitates real-time interaction between audio and video. Using this software, we were able to synchronize various visual parameters—such as shape, movement, and effects—with the timbre descriptors received from the computer. In other words, the visuals were predominantly influenced by melbands, as well as by loudness, speed, flatness, and centroid. During this project, we worked on many patches which led to three main patches that interact with the musical performance in distinct ways. In the Annex of this document, there are two other patches that demonstrate our aesthetic progression as we developed a method for musical interaction. This exploratory approach allowed us to develop a mapping strategy for visualizing sound changes during performance.
Figure 3: Patch 1.
In the first patch (fig.3), we familiarized ourselves with the process of using descriptors to generate visuals. We included both instrument’s descriptors to control a split-screen performance. The goal was to find a visual framework in Touch Designer to observe changes that occur in guitar and drum performance. During this trial, we focused only on pitch and loudness descriptors by assigning them to multiple visual parameters. This step also allowed us to fine-tune the Max patch to send out usable data. Since the descriptors are measured with different units, the ranges of each were all scaled within the range of zero and one which is a more standard and unified approach. The descriptor patching was done intuitively to gain an understanding of the visual parameters and to find a suitable framework for future workflow of visual modeling. The loudness was assigned to various parameters of a noise grid as its period, harmonics, amplitude, and exponent, to see how a single descriptor changed the aesthetic of this noise grid. This was a trial patch where each instrument simultaneously controlled multiple parameters of a 3D moving grid.

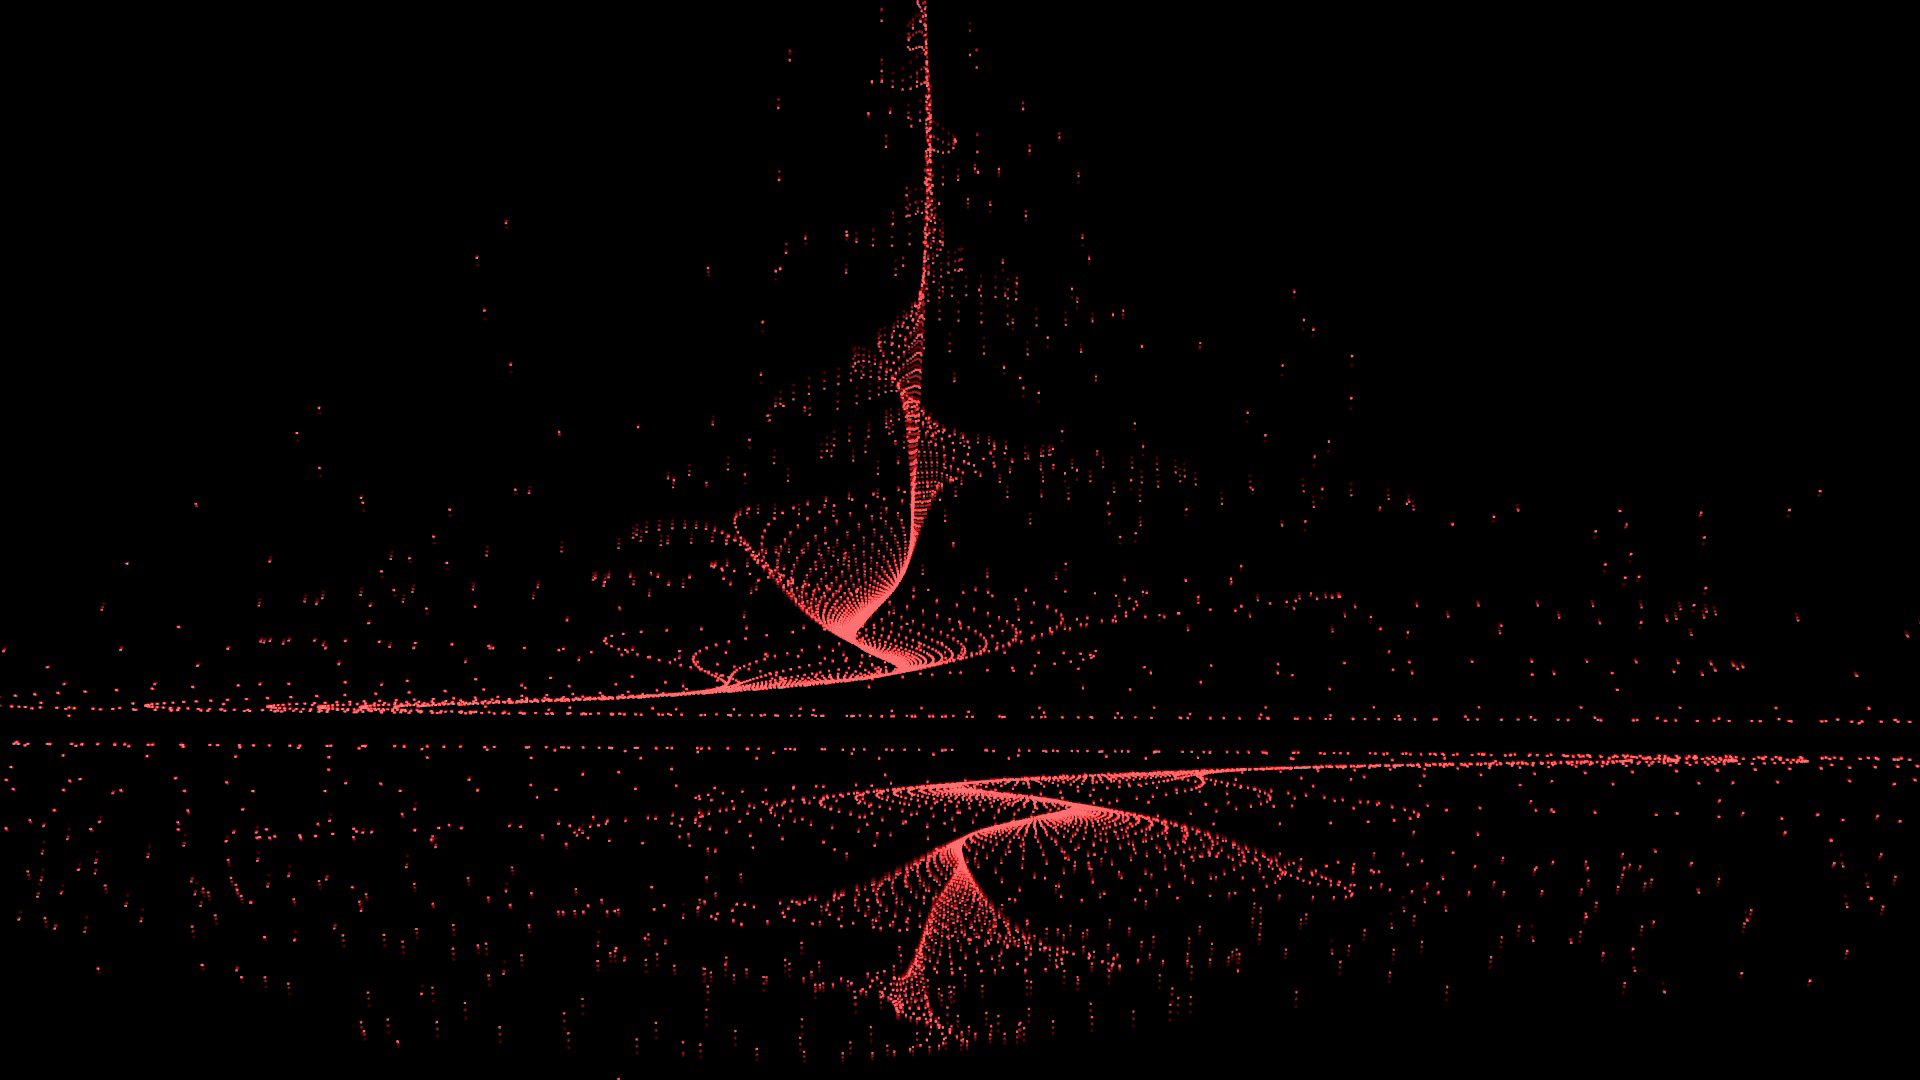
Figure 4: Patch 2.
In the second patch (Fig. 4), we used the data to create fluid characteristics for the shapes. We made aesthetic choices to apply the descriptors, generating various geometric shapes that remained in motion. The movement of the visuals was primarily driven by fluctuations in the melbands spectrum. This process was applied to two moving shapes, colored blue and red, representing two musicians performing as constantly shifting forms. The melbands are divided into 40 bands of the perceived spectrum, ranging from low to high frequencies. We averaged the low (0-13), mid (14-28), and high (29-40) bands to generate three channels of continuous spectrum data. Each channel controls the displacement of the particle grid matrix, with the resulting movements of these points in space directly representing our three-band audio spectrum.
Descriptors such as loudness, centroid, pitch, and their variances were mapped to two different types of interactions. One interaction triggers ADSR (Attack, Decay, Sustain, Release) envelopes (Curtis Roads, 2023), which control time-based effects such as point size and feedback. Feedback occurs when a system's output is looped back into its input, creating dynamic and evolving patterns. The other type of interaction is a continuous, time-based function that acts like a clock, passing data at varying speeds to influence parameters such as the rotation of the shape and its overall position. Both behaviours control changes such as the scaling and rotation of the grid particles. Beyond shape generation, this process also governs visual effects like feedback, tiling, and size. We used a MIDI controller to adjust the reactivity and sensitivity of these interactions, allowing us to monitor and manage the intensity of the effects displayed during the performance.
Figure 5: Patch 3.
The third patch (Fig. 5) is a system that focuses on the audio reactivity of the overall shape and adjusts itself depending on the amount of intensity, rhythm, and articulation produced by the musicians. Unlike the previous patch, where sensitivity was adjusted using a MIDI controller, we aimed to refine the shape’s behavior without manual adjustments. For this experiment, we explored solo instrumental interactions, further simplifying data management. We used sp.onset and sp.speed to calculate changes in tempo to govern the duration of the triggers and the speed of the continuous time-based functions. This approach allowed the performer’s speed changes to be visualized on the screen. Moreover, we used the directional changes of the sp.tools descriptor’s loudness, speed, and centroid to adjust interactions of the shape such as trajectory of points, amplitude of bursts, and articulation. When a significant number of directional changes are detected in the loudness and speed descriptors within a given time frame, the shape will move more erratically, with its points exhibiting greater amplitude in their motion. Conversely, when fewer changes are detected, the shape moves more smoothly and at a slower pace.
We also exploited the variance of the loudness to decide on the roundness of the trajectory of the moving points. As if the dynamic of the sound is abrupt or has an aggressive attack, then this will engage the points to move in a more articulate way. Conversely, if the attack of the sound is detected as smooth and soft, the trajectory of the points will be circling and less contracted. We used flatness to control the intensity of the visual trail generated by the moving points, known as the feedback effect, which becomes more pronounced as the sound grows noisier. The feedback effect creates a continuously evolving trail in the background that reflects previous values. To make the visuals more dynamic, we used the musician's speed to control the color shifts of the shape.
Synchresis and Visual Patch Creation Process
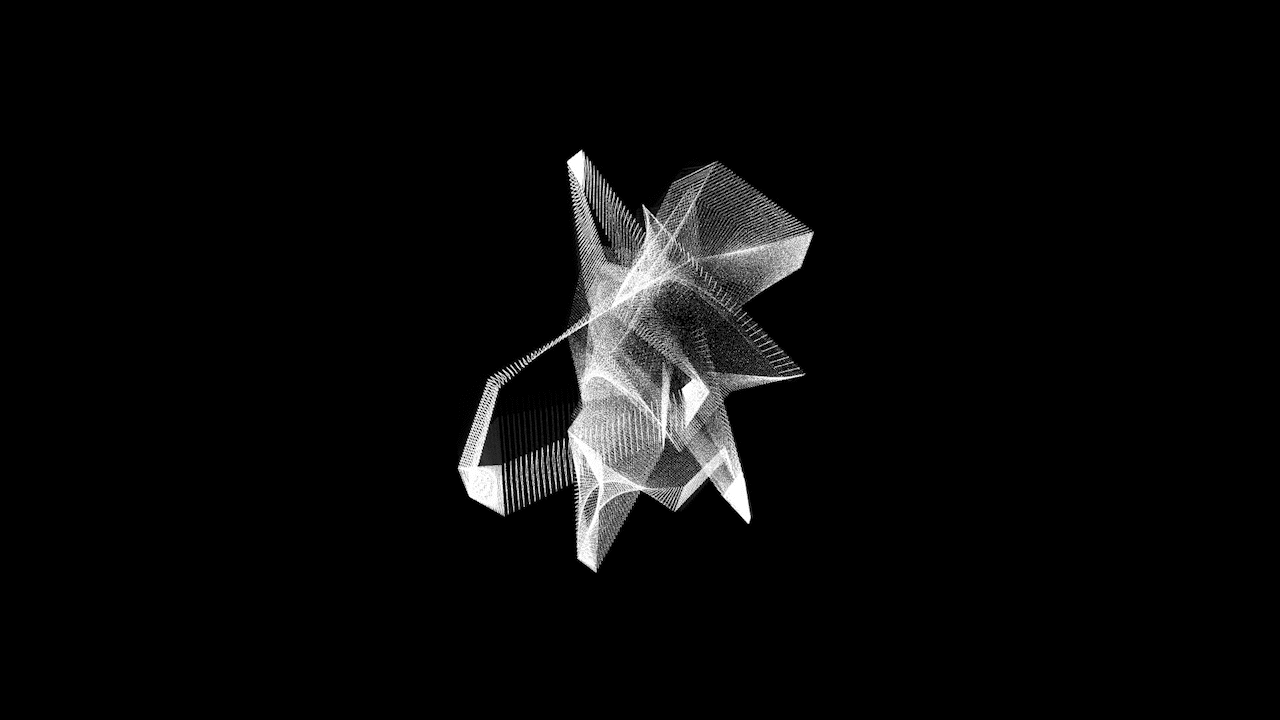
Figure 6
In the design of the visual patches, we built a generative approach to make sure that the visuals responded dynamically and intuitively to the musician’s sound. Since audio and video belong to two distinct realms, combining them for this project proved to be an inspiring challenge.
In the article Sound/Image Relations in Videomusic: a Typological Proposition, Myriam Boucher and Jean Piché develop the concept of synchresis introduced by Michel Chion in L’Audio-Vision (Chion, 2008). Synchresis, according to Chion, is defined as “the irresistible perceptual fusion between a sound event and a visual event.” (Chion, 2008) Boucher and Piché revisit and expand upon this concept by identifying various forms of relationships that sound and image can maintain. They propose a typology consisting of ten types of synchresis: “direct, cut-on-sound, anchoring, expected, delayed, gestural, phantom, congruent movement, and metric” (Boucher et Piché, 2020). These different forms of synchresis reveal that audiovisual synchronization can be more or less anchored or reactive, depending on the perceptual relationship between sound and image. The perception of these synchresis relies on the principles of Gestalt perception, which highlight the typo-morphological connections between sound and image.
Building on these principles, this typology offers concrete perspectives for the design of interactive audiovisual systems. These systems can integrate various audio descriptors available through tools like sp.tools objects to characterize and parameterize different types of synchresis. In other words, this approach allows for the creation of diverse forms of audio-reactivity, where specific visual morphologies are associated with precise sonic characteristics analyzed by audio descriptors. For example, a regularity in the sp.onset descriptor (which measures the consistency of sound attacks) can reflect a perception of stability, visually translated into a stable but slightly reactive form. Conversely, irregularity or rapid variation in sound speed can lead to a more gestural synchresis, resulting in dynamic and articulated visual forms. To summarize, synchresis can be an inspirational model for creating a synchronization system that reacts to the dynamic and spectral characteristics of the sound.
Throughout the process, we refined our approach by creating a hierarchy of three interactive layers. From the first to the third layer, the descriptors are injected into the system with varying immediacy. In the third layer, more time elapses, and specific conditions must be met before they are incorporated into the visuals. In other words, the second and third layers involve more time-delayed analysis compared to the first.
The patches feature three prominent layers of visual processing:
1. Shape Consistency: The first layer translates the spectral content into the initial framework of the shape. Stable spectral content, where energy is evenly distributed across the spectrum, generates smooth geometry. In contrast, unstable and fluctuating spectral content results in a more detailed and textured shape.
2. Shape Articulation Envelope: The second layer controls the shape’s behavior over time, responding to descriptors such as loudness, speed, spectral centroid, and spectral flatness. These descriptors influence different aspects of the shape’s articulation and movement. For example:
Loudness modifies the size and prominence of the shape, with directional changes in loudness affecting how the shape contracts.
Speed determines the smoothness or sharpness of transitions, and shapes the reactivity of the visual to follow fluctuations in the musical performance.
Spectral centroid and flatness can influence the color, brightness, or darkness of the visual, or add nuanced textural complexity through a feedback effect.
3. Large Shape Changes: Finally, the third layer is driven by abrupt or significant variations in sound, as indicated by the derivatives and confidence levels of all descriptors. These larger changes can result in drastic transformations of the shape, reflecting shifts in the sound. These changes could drive smooth transitions, short-term triggered effects, or even camera rotation.
Interaction and Synchronization
In order to translate the three different behavioral layers of the shape, as proposed above (derived from various types of synchresis), into parameter modifications for visuals, we can establish three main types of interactions, each offering distinct time-delayed functions or actions on visual parameters. In other words the patch’s interaction model integrates three distinct types of synchronization between audio descriptors and visual elements:
1. Fluid and slowly changing over time: Some visual parameters, such as the color or the speed of shape need to be animated by time-based functions that can be driven by descriptor values.
2. Triggers: Certain visual parameters quickly change following sharp sound events, which is often used for the size or the opacity of the shape.
3. Boolean Expressions: Simple logical conditions control parts of the visual patch. Transformations or behaviors will activate depending on the state of the audio descriptors. This interaction is used when shifting between different trajectory styles or activating short visual effects like rgb delay, feedback, shape reactivity,and others.
Conclusion and Future Work

Figure 7
Throughout this project, we harnessed the potential of machine learning tools to enhance creativity and expressivity in audiovisual interaction. Leading the project revealed that utilizing a diverse range of timbre descriptors unlocks significant interactivity and creative potential. This approach enabled us to represent musical characteristics within a visual space, including the consistency of shapes, their behavior and articulation, and directional changes. We believe this layered methodology provides a valuable framework for designing systems that integrate multiple variables or descriptors as inputs. A key takeaway is that descriptors provide a large quantity of data, and managing multiple data streams for interaction presents significant challenges. We found that incorporating too many descriptors can overwhelm the system, resulting in excessive movements and a lack of coherence between the musical performance and the visuals.
When working with a single descriptor, such as amplitude, the relationship between the input and output is often clear and easy to perceive. However, introducing additional descriptors can disrupt this clarity. As a result, designing an interactive model that effectively leverages a select few specific data points became the central focus of our work and research. This challenge prompted us to develop a multilayered technique for strategically approaching audiovisual mapping using a limited number of inputs. This involved experimenting with various synchronization methods and intensities, balancing subtle and more dynamic changes. As a result, the multilayered system became more intuitively perceptible to both musicians and listeners.
As a potential future direction, we aim to develop a system with more thoughtfully chosen inputs (descriptors) and a reduced number of variables. The experience revealed that timbre descriptors hold great promise for enhancing interactions with musicians in audiovisual performance. Furthermore, this approach to mapping is not limited to a specific aesthetic or instrumental setup and can be adapted to various projects or musical formations. For example, the choice of descriptors would differ significantly for a piano versus a drum kit, as each instrument requires descriptors tailored to its unique behaviour and characteristics. This project has significantly influenced our work, providing an opportunity to explore a wide range of tools to determine what works best in various musical scenarios. For future endeavors, we have established working methods that will be invaluable in creative contexts, enabling us to further explore and highlight interactions between musicians and visuals. The approaches developed during this project have offered valuable insights into designing audiovisual systems tailored to specific artistic needs.
This project would not be possible without the generous funding and resources offered by ACTOR Project, CIRMMT, and IICSI.
Works Cited
Boucher, M., & Piché, J. (2020). Sound/image relations in videomusic: A typological proposition. In Sound and Image (pp. 13-29). Focal Press.
Centre Pompidou. (n.d.). Resource: ROacks9. Retrieved December 20, 2024, from https://www.centrepompidou.fr/fr/ressources/oeuvre/ROacks9
Chion, M. (2019). Audio-vision: sound on screen. Columbia University Press.
FluCoMa. (n.d.). Reference. Retrieved December 20, 2024, from https://learn.flucoma.org/reference/
Koffka, Kurt. (1963) Principles of gestalt psychology. routledge.
Roads, C. (2023). The computer music tutorial (Second edition). The MIT Press.
SP-Tools – Machine Learning Tools for Drums and Percussion « Rodrigo Constanzo. (s. d.). https://rodrigoconstanzo.com/sp-tools/
Yang, M., Llano, M. T., & McCormack, J. Exploring Real-Time Music-to-Image Systems for Creative Inspiration in Music.