Auditory Scene Analysis
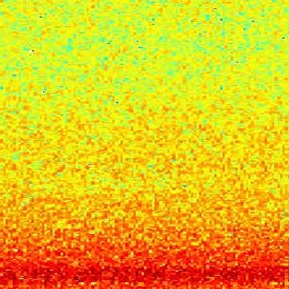
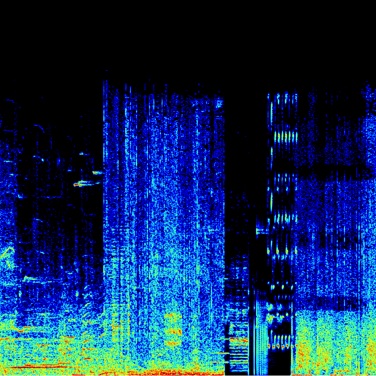
This is a spectrograph, a way of visualizing sound in which the y axis represents frequency, the x axis represents time, and darkness or colour represents concentration of energy. Looking from bottom to top shows how the sound energy is distributed on the continuum from low to high, and looking from left to right shows how that distribution changes over time...